
US Military vs Indian Military!
A category-by-category comparison of two very different militaries, built on dated public data, with conflicts between sources flagged.
Data cutoff: November 14, 2026. Every figure below carries its reporting year. Where sources disagree, the disagreement is stated rather than smoothed over.
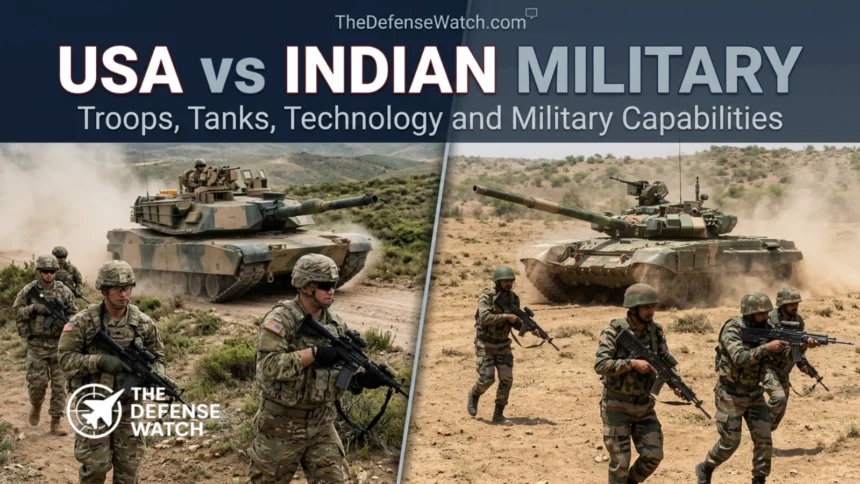
The United States and India are not natural rivals, and comparing them is less about who would win than about what each force is built to do. The US maintains a globally deployed, technology-heavy force designed to fight far from home. India maintains a very large, land-centered force built around two contested borders and a growing maritime interest in the Indian Ocean.
Counting equipment alone misleads. A tank on a ledger is not a tank that starts, and a fighter in inventory is not a fighter that flies on day thirty of a war. This analysis separates what each country owns from what it can deploy and what it can sustain.
Spending: A Gap of Roughly Ten to One
SIPRI’s 2025 data puts US military spending at $954 billion, about 33 percent of the world total, a fall of 7.5 percent from the prior year. India spent $92.1 billion, up 8.9 percent, or about 3.2 percent of the world total and roughly 2.3 percent of GDP. SIPRI put world spending at $2,887 billion.
The gap is real but needs context. The two budgets are not built the same way.
- United States, FY2027: The administration requested about $1.15 trillion in discretionary national defense funding, plus an assumed $350 billion in mandatory reconciliation funds. The FY2027 defense authorization had not been enacted as of the latest Congressional Research Service tracking reviewed for this article.
- India, FY2026-27: The defense allocation is ₹7,84,678 crore, roughly $86–87 billion, up 15.2 percent. Capital outlay is ₹2,19,306 crore, up 21.84 percent. About ₹1.39 lakh crore is earmarked for domestic procurement, or 75 percent of capital acquisition. Pensions take about 21.8 percent of the budget.
That last point matters. A large share of India’s budget pays for people, including retirees, rather than new equipment. The US also carries heavy personnel and health costs, but a far larger absolute sum remains for research, procurement and global logistics. Currency conversion also understates India’s domestic purchasing power, since local pay and some local manufacturing cost less than the exchange rate suggests. Even adjusting for that, the capability gap in funded technology programs remains wide.
Personnel: India Is Bigger, the US Is More Capital-Intensive
The US had 1,267,738 active-duty personnel as of September 30, 2025, according to Air & Space Forces Magazine’s almanac data. By service:
| Service (US, Sept. 30, 2025) | Active personnel |
|---|---|
| Army | 445,334 |
| Navy | 327,936 |
| Air Force | 311,920 |
| Marine Corps | 173,096 |
| Space Force | 9,446 |
The FY2026 authorized active-duty end strength was 1,302,800, so the force sat below its authorization.
India’s active strength depends on the source. The IISS Military Balance 2025 edition, as reported by Reuters, counts about 1,462,400 across the three services: Army 1,237,000, Navy 75,500 and Air Force 149,900. It lists the Coast Guard separately at 13,350. An aggregator citing Indian Ministry of Defence in-position data gives about 1.38 million for 2024. The difference likely reflects authorized versus actual strength, but the sources do not say so explicitly.
India’s Army dominates its force structure. Its Navy and Air Force are small relative to the size of the Army and relative to their counterparts in the US.
Land Forces: Mass Versus Modernization
United States. The Army fields 16 armored brigade combat teams. At 87 tanks per brigade, that implies about 1,392 tanks in those formations. Open-source estimates put the total Abrams inventory near 4,650, including tanks in storage and other units. M-1E3 prototypes are expected in 2026. The ground force’s strength lies less in tank counts than in aviation, long-range fires, intelligence and logistics, and in the ability to move all of that overseas.
India. The IISS 2025 edition lists 3,740 main battle tanks and 9,743 artillery pieces. A defense-press analysis in Asian Military Review gives a more cautious picture: authorized strength of about 3,700, with the actual fleet “much less.” Reported composition includes roughly 2,400–2,500 T-72s, more than 1,000 T-90s and about 124 Arjun tanks. A program to extend the life of 1,200 T-72s began in March 2026. The Future Ready Combat Vehicle, planned at 1,770 units, has not been fielded.
Artillery modernization is under way but incomplete. India operates 109 K9 Vajra self-propelled howitzers and 145 M777 lightweight howitzers. The indigenous ATAGS gun may enter service around 2029–30.
Assessment. India has more soldiers and a dense force posture facing Pakistan and China. The US has fewer tanks in active formations but a stronger enabling structure. Neither force should be judged on tank counts alone.
Air Power: Quality, Age and Fleet Size
US Air Force. As of May 5, 2026, the Air Force had 1,098 fighters against a statutory requirement of 1,145. A different measure, combat-coded total aircraft inventory, was about 1,271. The two numbers answer different questions: the first counts primary mission aircraft under a statutory definition, the second counts combat-coded aircraft including backups and others.
The fleet is old. Average age is about 27.4 years. The Air Force operates 185 F-22s. Airlift is a distinct US advantage: 222 C-17As and 52 C-5Ms, though the C-5 fleet’s mission-capable rate was reported at 37 percent. The tanker force is about 475 aircraft. Airlift and aerial refueling are what let the US project power across oceans, and India has nothing comparable at this scale.
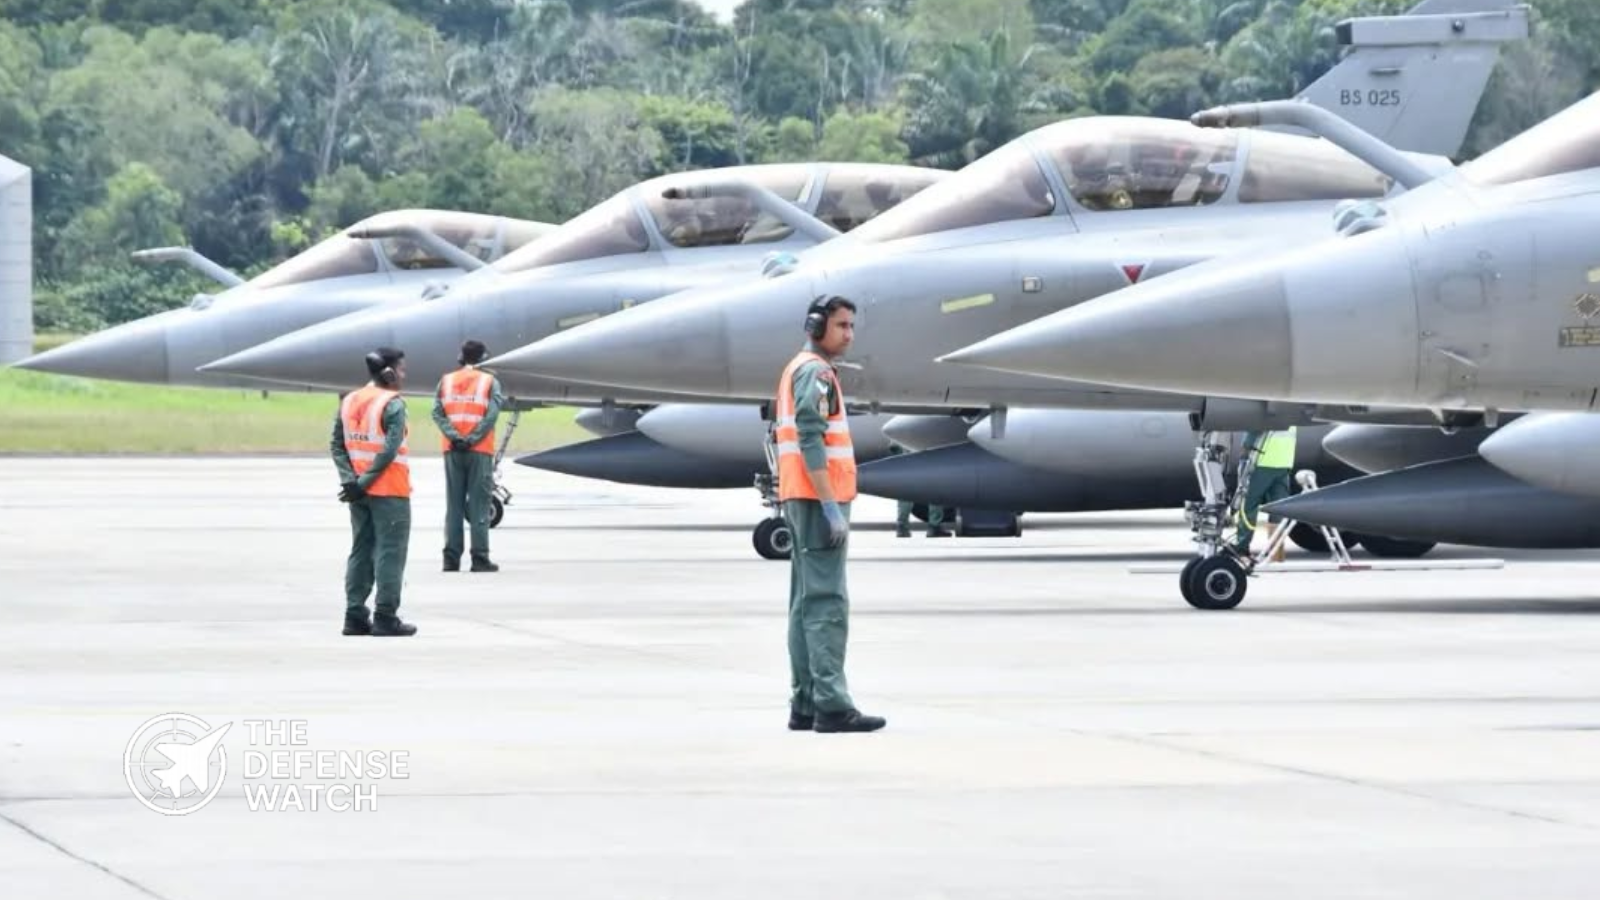
Indian Air Force. The IAF operates 29 fighter squadrons against a sanctioned strength of 42, according to Air Chief Marshal remarks reported in October 2026. He argued that about 40 jets a year would be needed to stem the decline.
Several programs explain the gap:
- Rafale: 36 are in service. In a separate step, 114 additional Rafales have been cleared through an Acceptance of Necessity, but no contract had been signed as of the latest reporting.
- Tejas Mk1A: 180 aircraft are on order. None had been handed over as of September 2026, and only 10 of 99 engines had been received by August 2026.
- S-400: Four of five squadrons have been delivered. The fifth is expected in November 2026, but delivery was unconfirmed in the sources reviewed, and some reporting points to 2027.
Assessment. The US advantage is in fleet size, stealth, airlift, tankers and surveillance. The IAF is capable and experienced, but squadron strength is below requirement and deliveries of domestic aircraft are late.
Naval and Strategic Forces
United States. The Congressional Budget Office’s May 1, 2026 analysis counted 291 battle force ships: 11 aircraft carriers, 14 ballistic missile submarines, 52 attack and guided-missile submarines, and 85 large surface combatants. This is the world’s only truly global blue-water navy.
India. India has about 140 warships, two aircraft carriers and about 17 diesel-electric submarines. It also has three ballistic missile submarines; INS Aridhaman was commissioned on April 3, 2026, though the announcement was unofficial. India has no nuclear-powered attack submarine. The Navy has said it aims to grow to more than 200 ships and submarines by 2035. That is a target, not a delivered fleet.
Nuclear forces. The SIPRI Yearbook 2026 estimates India holds about 190 warheads, of which about 12 are deployed. SIPRI also notes that the US and Russia together hold about 83 percent of stockpiled warheads. India’s arsenal supports a deterrence posture, not parity with the US.
Command Structure and Jointness
The US operates through joint combatant commands, which integrate Army, Navy, Air Force, Marine and Space Force assets under a single regional or functional commander. India has 17 single-service commands. A plan for integrated theatre commands remains pending, with the Chief of Defence Staff reportedly seeking defense minister approval.
This matters in war. Joint planning, shared targeting data and unified logistics are force multipliers that do not appear in equipment tables.
Munitions and Industrial Capacity: The Sustainment Test
This is where the comparison becomes most revealing, and where public data is thinnest.
US stockpiles after the 2026 Iran war. CSIS analysis indicated that the 39-day conflict drew down roughly half of US Patriot and THAAD stocks, though its estimates were revised between its April and July publications. CSIS also assessed that rebuilding Patriot, THAAD and Tomahawk inventories would take more than three years. An AP report relaying a separate analysis reached a similar conclusion about Patriot stocks.
US production versus targets. The picture on 155mm artillery shells shows the gap between a goal and an output.
- The Defense Department Inspector General reported production of about 36,000 complete rounds per month in March 2026, against a goal of 100,000.
- Separate figures describe different things. The same period saw about 46,000 metal parts per month, and an Army official had cited 56,000 in February. These are not the same measure and should not be compared directly.
- Reporting on the Texas facility at Mesquite described problems producing usable rounds.
For air defense, Lockheed Martin delivered 620 PAC-3 MSE interceptors in 2025 and has a framework agreement targeting roughly 2,000 per year. That is a target, not current output.
India’s position. Reported figures suggest about 90 percent of Army ammunition is domestically produced, though Excalibur precision shells remain imported. India’s defense production reached ₹1.78 lakh crore in FY2025-26, with exports of ₹38,424 crore, according to Ministry of Defence figures. War wastage reserves were reportedly 40 days. The Defence Secretary has said stocks exceed pre-Operation Sindoor levels in some categories, without publishing numbers. Production lines have not been tested beyond a few days of high-intensity conflict.
India’s import dependence remains significant. SIPRI data show Russia as the largest supplier at about 40 percent of Indian arms imports. Public sources reviewed do not establish specific dependencies on rare earths or semiconductors for either country, and this article makes no claim on them.
Assessment. Neither country has proven it can sustain a prolonged, high-intensity war at current production rates. The US has far greater absolute capacity and a larger industrial base, but its recent shortfalls show that capacity takes years to expand. India has a more self-reliant ammunition base for conventional munitions, but less breadth in advanced missiles, aircraft and engines.
Operational Evidence: Operation Sindoor
India’s four-day conflict with Pakistan, from May 7 to 10, 2025, is the most recent test of Indian air and missile forces. Claims about losses on both sides are disputed, and this article does not adopt either side’s account. An Australian Air Power Development Centre analysis treated it as a case study in near-peer air warfare. It is a useful reminder that short conflicts reveal command, intelligence and munitions issues, but they do not test sustainment.
Relationship, Not Rivalry
India and the US signed a 10-year defense framework on October 31, 2025. It is a cooperation agreement, not an alliance, and it does not commit either country to fight for the other. Allied forces, including those of other US treaty partners, are outside the scope of this comparison and should be assessed separately.
Category-by-Category Assessment
| Category | Edge | Why |
|---|---|---|
| Budget | United States | Roughly ten times India’s spending (SIPRI, 2025) |
| Active personnel | India (on paper) | Larger Army; US force is smaller but more capital-intensive |
| Land forces | Mixed | India has mass in a regional setting; the US has superior enablers and mobility |
| Air power | United States | Larger fleet, stealth, airlift, tankers; IAF below sanctioned squadron strength |
| Naval power | United States | 291 ships and 11 carriers vs about 140 ships and two carriers |
| Nuclear | United States | Far larger arsenal; India holds a credible but much smaller deterrent |
| Joint command | United States | Integrated combatant commands; India’s theatre reform pending |
| Home-defense geography | India | Operates close to home and near its supply base |
| Conventional ammunition self-reliance | India (reported) | High domestic share; limited public proof at scale |
| Advanced missile and aircraft supply chains | United States | Larger industrial base, though recent munitions shortfalls are documented |
The table is a summary of judgments, not a scoreboard. A hypothetical contest would depend on geography, objectives and whether the US could bring its forces to bear. Scenario reasoning here is analysis, not prediction.
Limits of This Comparison
Several caveats apply.
- Public data on readiness, as opposed to inventory, is limited for both countries, and especially for India.
- IISS Military Balance 2026 country tables were not accessed for this article, so Indian equipment figures rely on the 2025 edition and secondary reporting.
- Indian squadron and fleet numbers vary by source and date.
- Some figures come from press reports of official statements rather than original documents.
Frequently Asked Questions
By active personnel, yes, on most counts. The IISS 2025 edition puts India’s three services at about 1.46 million, against about 1.27 million for the US as of September 2025. By spending, ships, aircraft and global reach, the US is far larger.
SIPRI’s 2025 figures are $954 billion for the US and $92.1 billion for India. India’s FY2026-27 budget is about ₹7.85 lakh crore, roughly $86–87 billion.
Yes. SIPRI Yearbook 2026 estimates about 190 warheads, with about 12 deployed. India has three ballistic missile submarines, with INS Aridhaman reported commissioned on April 3, 2026.
29, against a sanctioned strength of 42, according to the Air Chief Marshal’s remarks reported in October 2026.
No. They signed a 10-year defense framework on October 31, 2025, which deepens cooperation but is not a mutual defense treaty.
Recent evidence is mixed. The Defense Department Inspector General reported 155mm production of about 36,000 rounds per month in March 2026 against a 100,000 goal, and CSIS estimates that rebuilding key missile stocks will take more than three years.